Wednesday, 22 March 2017

Grade Level Math Prompt

MATH PROMPT

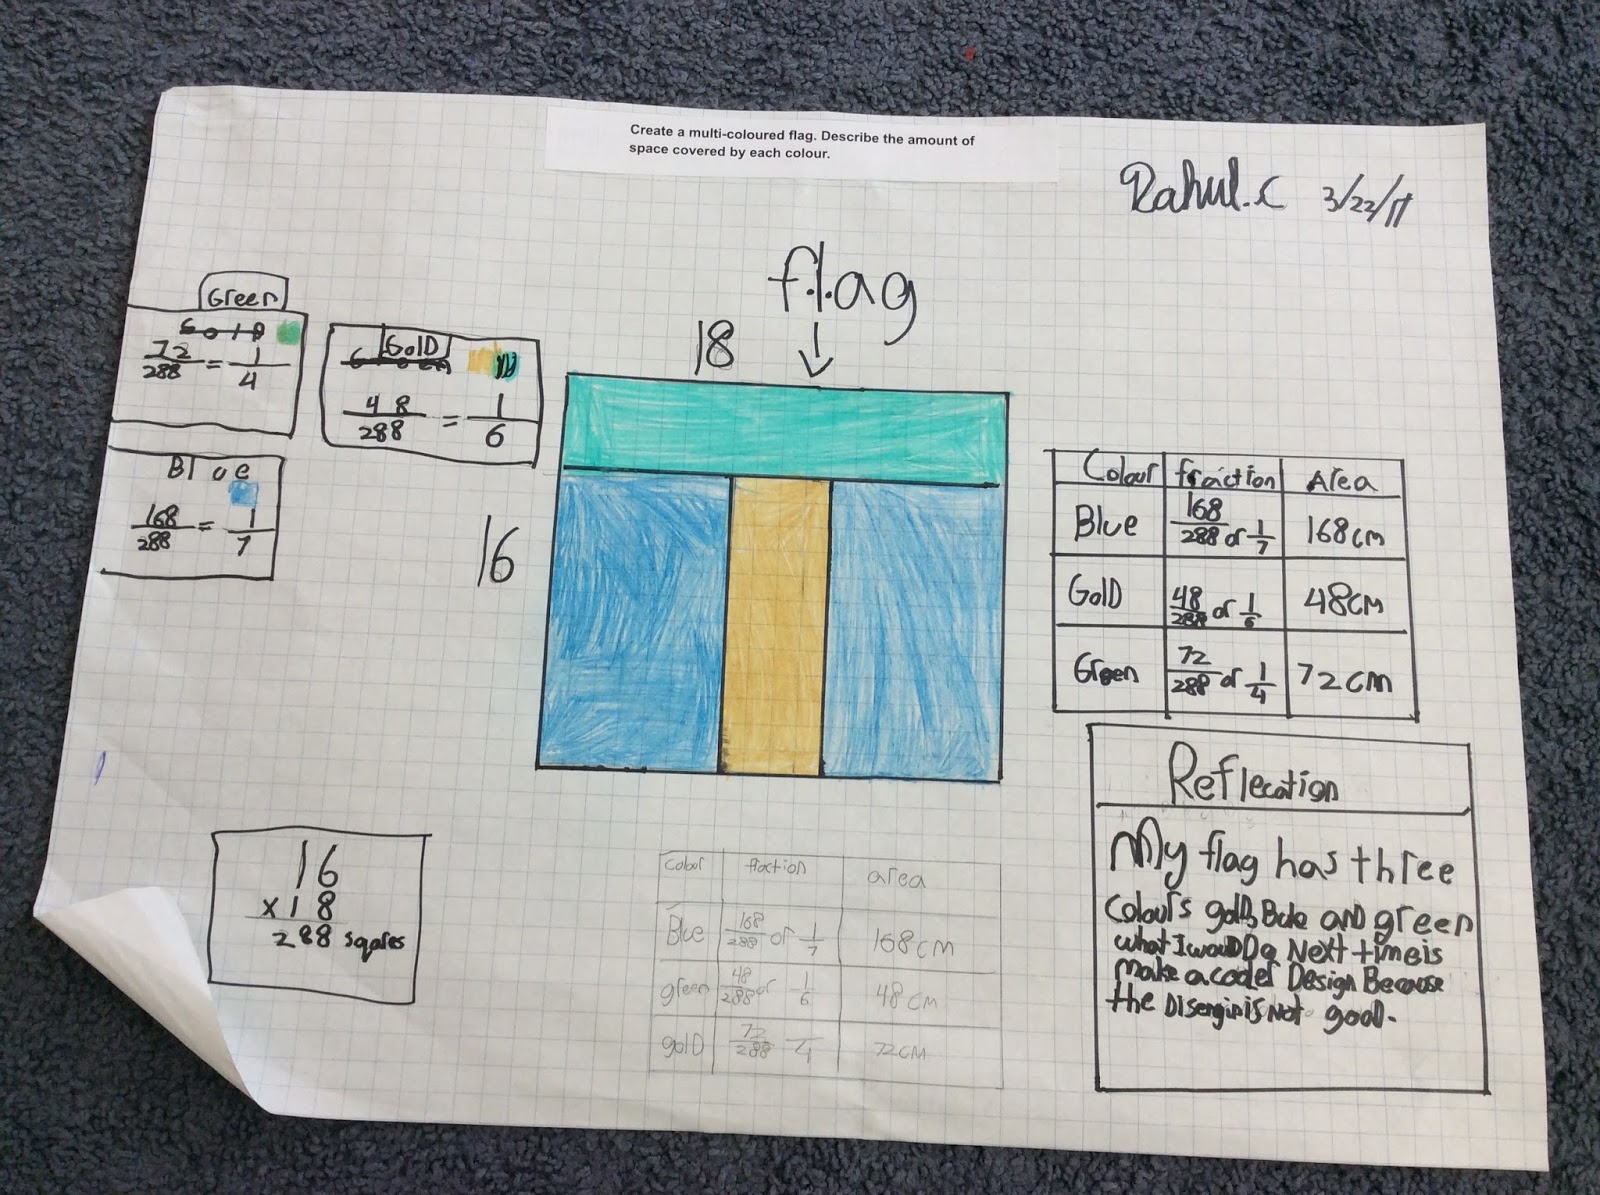
Create a multi-colour flag. Describe the amount of space covered by each colour.

To get the students excited about the Math Task, they first did a World Flag Quiz. Some interesting observations were made in regards to the design of some flags.

Next, we played a Fraction Flag Game as a Minds On Activity. Students practised colouring the grid in one half (1/2) and one third (1/3). Some students displayed creative thinking in how the grid was coloured. This led to a great conversation about simplifying fractions in order to find their equivalence.


Students were then instructed to do a rough sketch of what their flags would look like bearing in mind that it had to be coloured with at least three colours.

Here's are a few pics of the sketches showing some of the strategies used to approach the question:


Students' Final Work
Good job kiddies! Loved the Math Talk. Great ideas and learning.


Wednesday, 8 March 2017

Creating an Ad - Health/ Media Literacy


Creating an ad based on three profiles.Can you guess the target group for each ad? Are the ad techniques effective? Would you purchase the products?


Tuesday, 7 March 2017

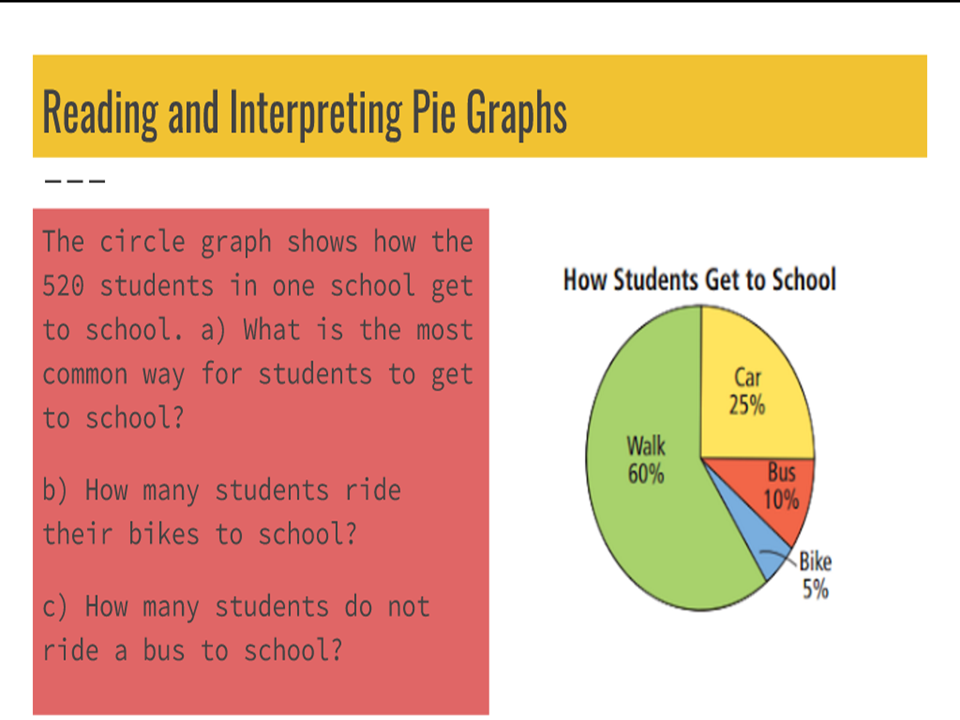
Data Management - Pie/Circle Graphs

A circle graph shows how a category of data compares to the whole. The circle is divided into sectors.  Each sector represents a category. Each category represents a specific percent of the whole. The area of the sector is the same percent of the area of the circle. Circle graphs are easier to use when there are not too many categories. Too many sectors make a circle graph difficult to read. Circle graphs are easier to interpret when the percents are easily distinguishable. If the percents are too close in value, it is hard to see the differences in the sections.

KEY IDEAS
*A circle graph shows how each category of data compares to the whole using percents. 
*The sum of all the percents in a circle graph is 100%. 
*Circle graphs are easier to interpret when there are a small number of categories and when the percent values are not too close together.