Student's first collaborative task to manage the data given.


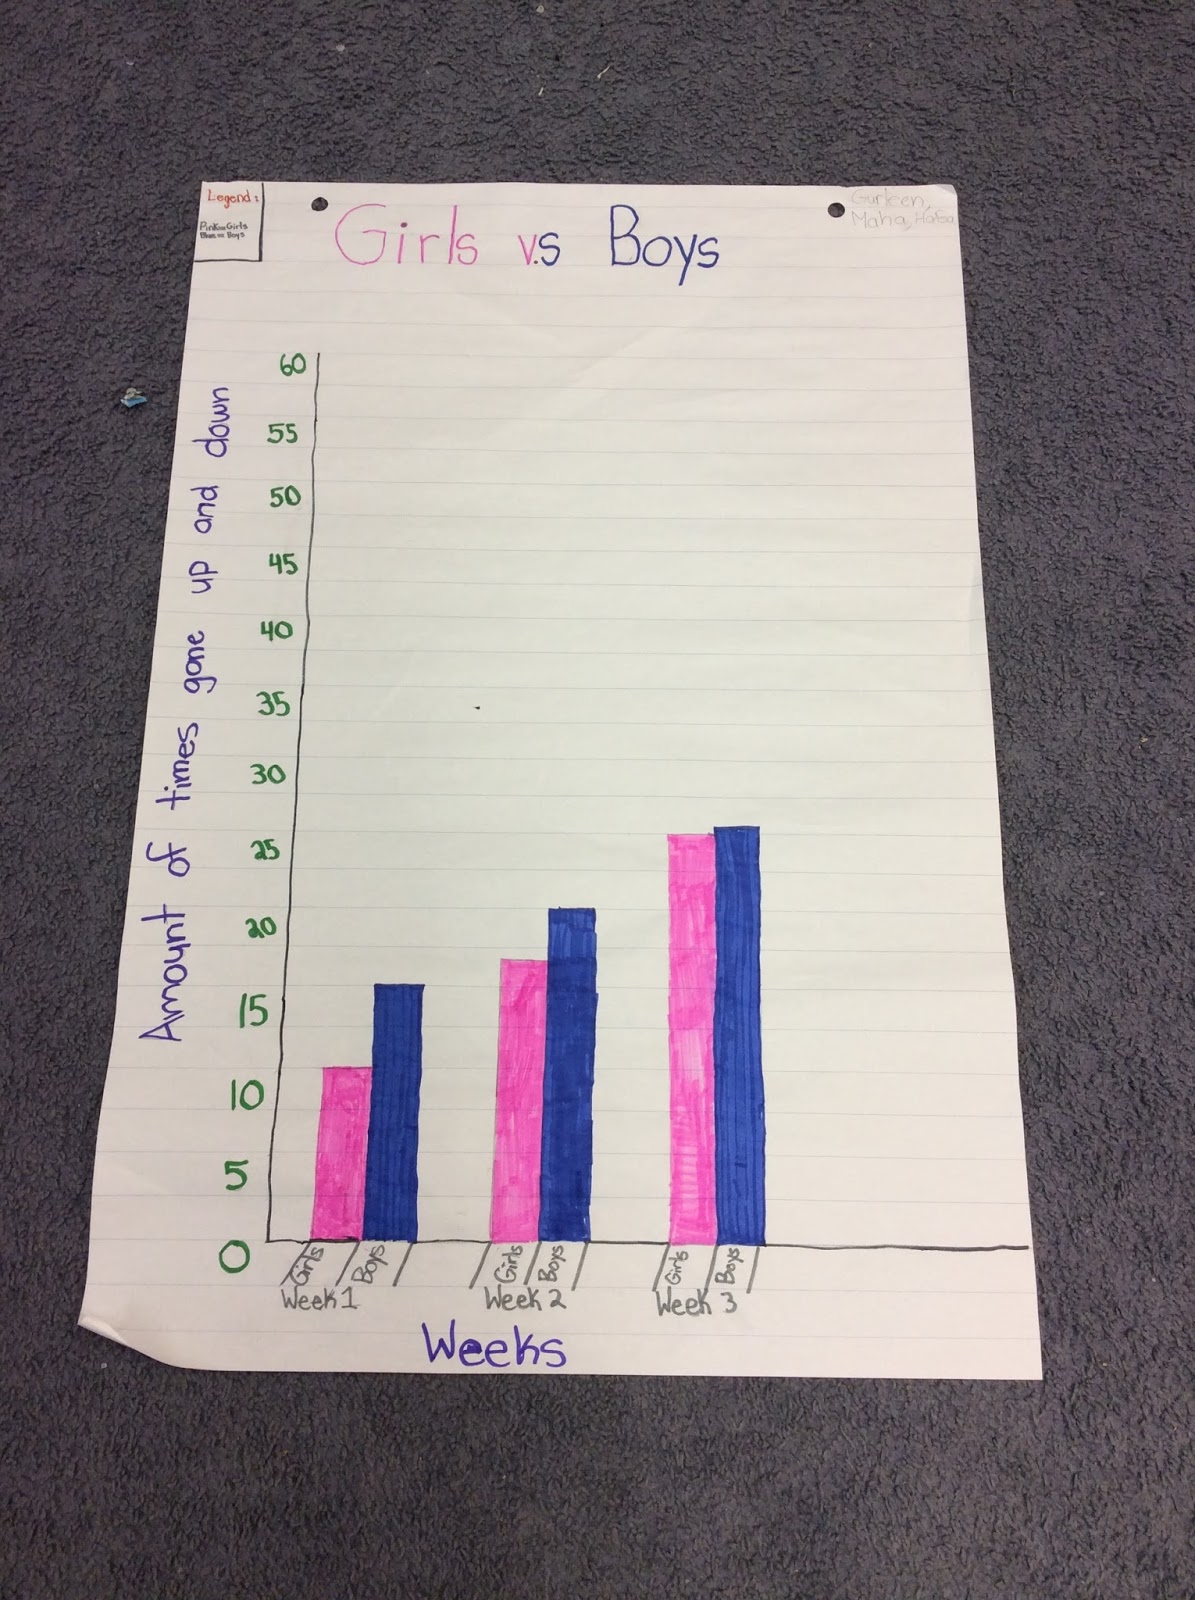

After examining and discussing our observations about each group's poster in our Math Congress, we looked at the same data set represented by a computer-generated double bar graph. Students had to state what was absent from the graph.

We also discussed the difference between a bar graph and a histogram as well as the components of a bar graph


That's so cool Mrs. Rashid!!! I didn't know there was such thing as a histogram. Guess you're still teaching former students ;)
ReplyDeleteHi Eesha! So good to see you still check out the blog. Glad you learnt something new.
ReplyDelete