Tuesday 28 February 2017

Data Management - Line Graphs/ Double line Graphs

* A line graph is a graphical display of information that changes over time. Within a line graph, there are points connecting the data to show a continuous change. The lines in a line graph can either go up (ascend) or go down (descend) based on the data. We use a line graph to compare different events, situations and information.

Introducing the scenario


Do you see a trend or pattern? Could you relate this to a story?

Pair Work


Thursday 16 February 2017

Science/ Literacy


Reading a graphic comic in Literacy class to learn more about the Digestive System before our next Science class. A lot of new learning!

Fun Fact
*The stomach is a pear-shaped organ that expands to hold the food you swallow. An adult stomach can hold about 3.2 pints (1.5 liters) of material at one time.

*After the body uses the nutrients from food, the bean-shaped kidneys remove extra waste from the blood. The kidneys also remove extra water from the body. The waste and water collected by kidneys exit the body as urine.


Tuesday 14 February 2017

Human Organ Systems - Lesson #2


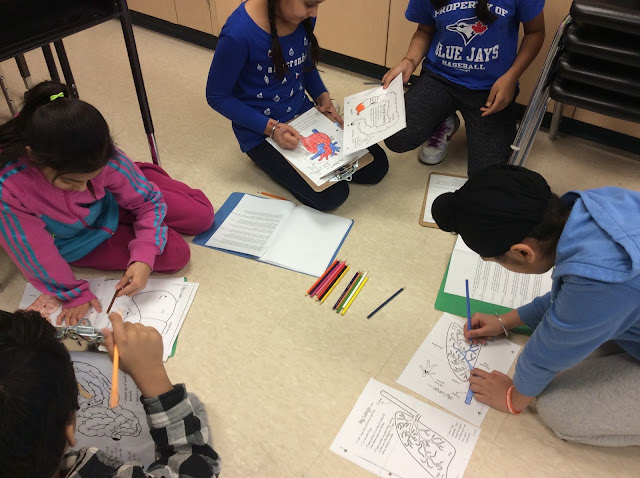
Colouring the organs


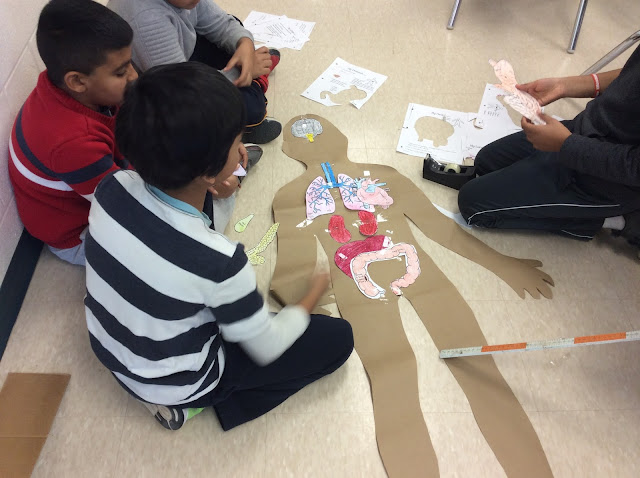
 Putting the organs together


The finished models. Are the organs in the correct spot?