Bonjour! My name is Kicia Abdur-Rashid and I've been a teacher in Canada for a number of years. This blog chronicles my journey teaching Grade 5. Come along with me as I share stories about teaching in the Junior Division!
It was interesting to observe that most students chose to represent the data using a broken-line graph.
Big Idea: Line graphs are better suited at showing changes over a period of time (Continuous data)
whereas bar graphs are better at comparing things between different groups or categories (discrete data)
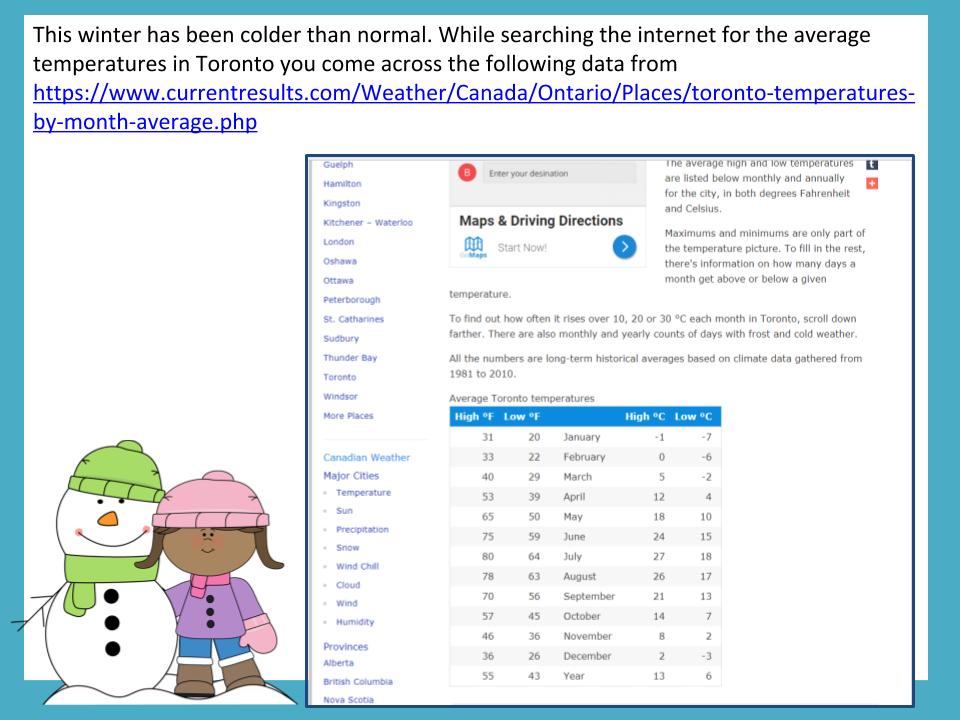
Student's first collaborative task to manage the data given.
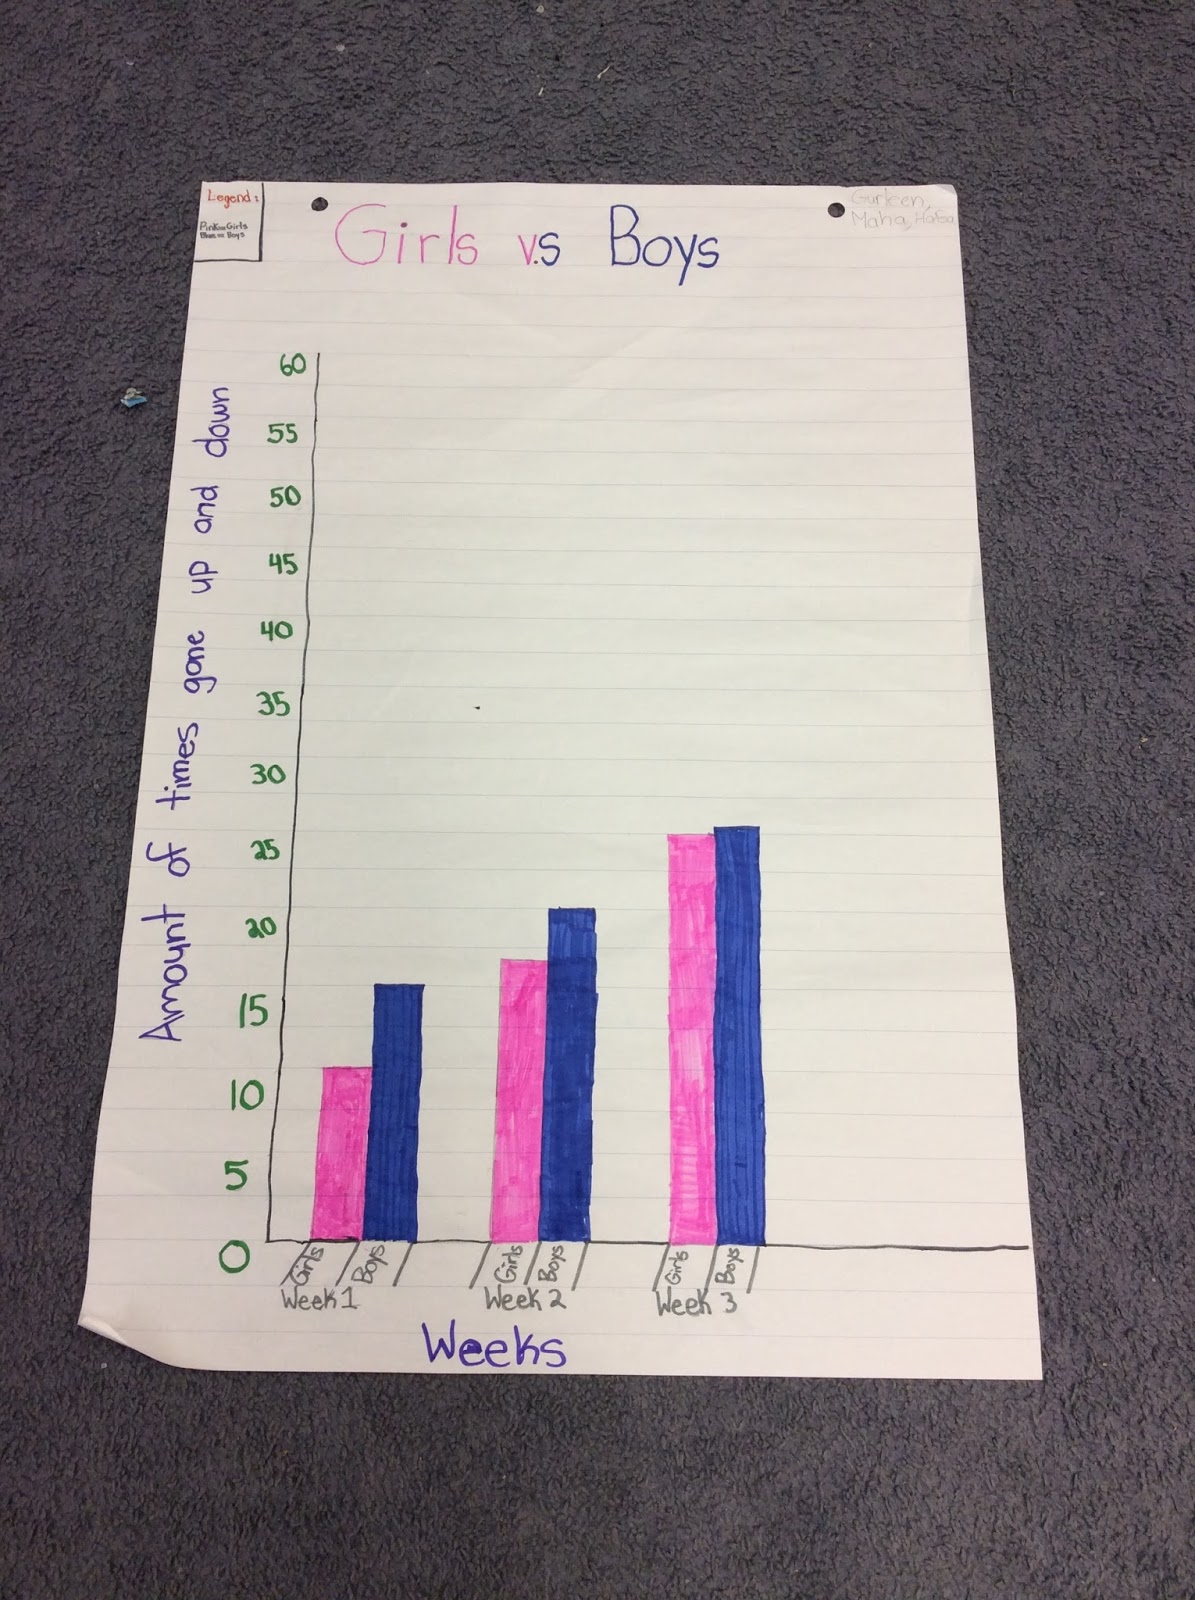
After examining and discussing our observations about each group's poster in our Math Congress, we looked at the same data set represented by a computer-generated double bar graph. Students had to state what was absent from the graph.
We also discussed the difference between a bar graph and a histogram as well as the components of a bar graph