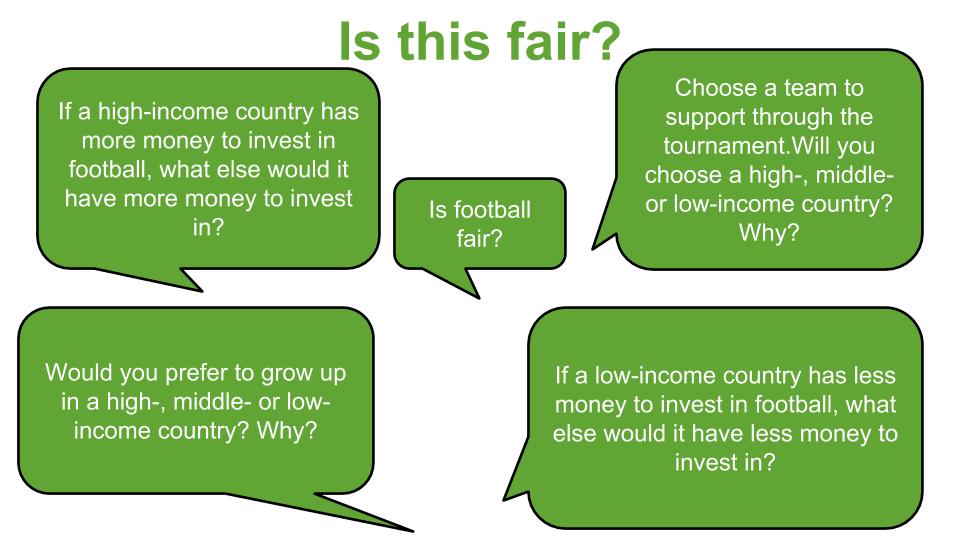
This cross-curricular resource for 9-14 year olds uses the World Cup to engage learners
critically with the question: Is the world a fair place?
Through this engagement, they will think carefully about one key current global issue –
inequality. Learners will compare statistics about the countries playing in the World Cup,
including their FIFA rankings, average incomes, and levels of inequality. They will also
explore gender inequality through the lens of football and think critically about why fewer
women play football than men. Finally, learners will consider how fairness relates to rules,
not just in making the game of football fair, but in our society in general.